Market Report 1st Quarter 2013 West Putney East Putney and Southfields

“We analyse the absolute performance of residential property in each of the 14 London areas covered by Douglas & Gordon. We also examine the relative performance, comparing different unit sizes and different areas. Finally, in a city that attracts global investors, we try to place residential property performance in a wider macro-economic context.”
West Putney, East Putney and Southfields
How has the area performed relative to the rest of D&G (S/W) land* between 2007–2012?
Chart 1
On average capital values have not recovered to 2007 levels and have lagged behind other areas in D&G (S/W) land.
One bedroom flats and four bedroom houses have been the worst relative performers, two bedroom flats and three bedroom houses the best.
In the first few months of 2013 there is evidence that a catch up has started.
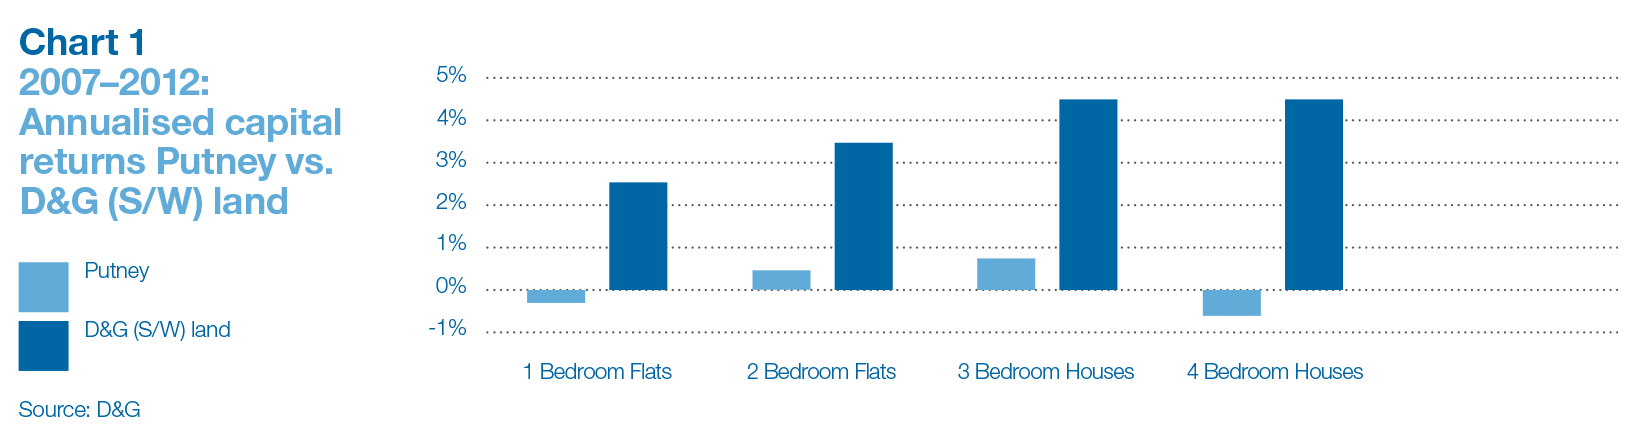
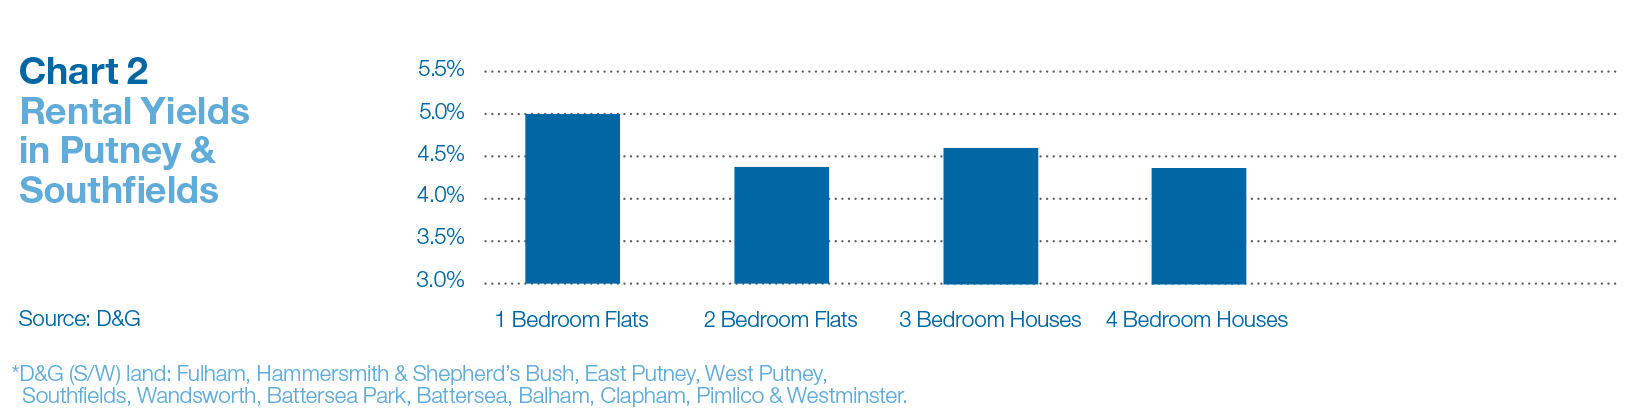
Chart 2
Rental yields in the area look very attractive relative to other parts of D&G (S/W) land.
Yields of 5% and above are available on some one bedroom flats.
Yields on family houses are amongst the highest in D&G (S/W) land.
Conclusion
The excellent state schools and good transport links suggest that the area will benefit from investor interest and we expect capital values to start to close the gap with other areas of D&G (S/W) land over coming months.
Our data suggests that there are more first time buyers than in other areas of D&G (S/W) land reinforcing the reputation of the area as one where people like to settle.
Southfields three and four bedroom houses have risen rapidly (+20% over the last 18–24 months) as capital has relocated there from other areas.
We expect, over the next few months, houses in Putney to outperform their Southfields equivalents. Average sized Putney houses have broken the £1m SDLT ceiling, Southfields houses are bumping up against it.
Larger houses in the upper west Putney area, due to their scarcity, will attract buyer interest from across London if properly marketed.
Inflation
How inflation eats away at real incomes
Chart 1
Over the 3 years to December 2012 the annualised inflation rate (RPI) has been 4.22%(2.9% over the last 15 years). Source: ONS
At an annualised rate of 4% over 15 years inflation will erode your real income by 44%.
To protect real income an asset must generate income growth that matches inflation.
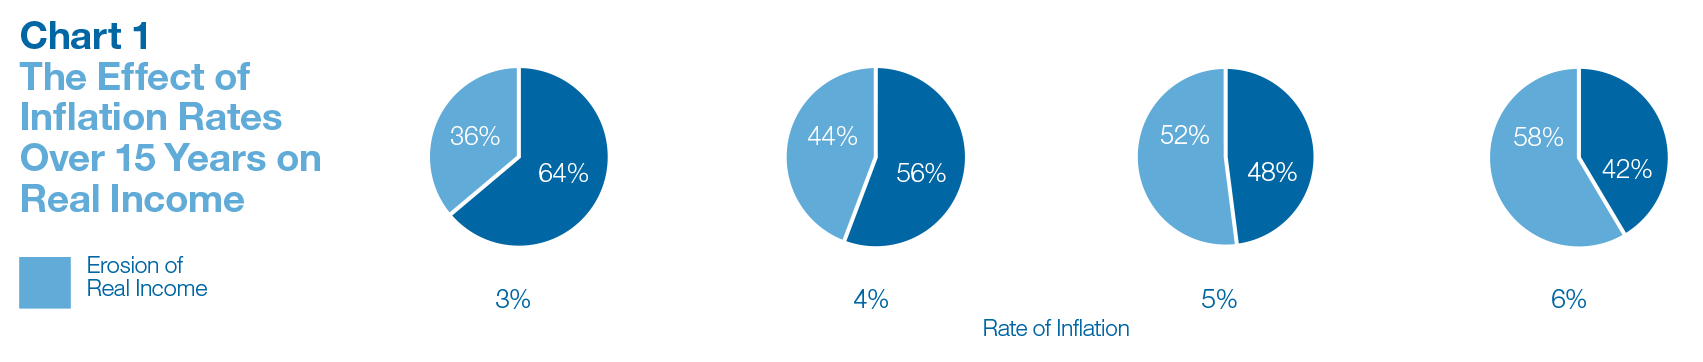
Chart 2
Different property unit sizes across D&G (S/W) land have shown different rates of rental growth but all have matched or exceeded inflation.
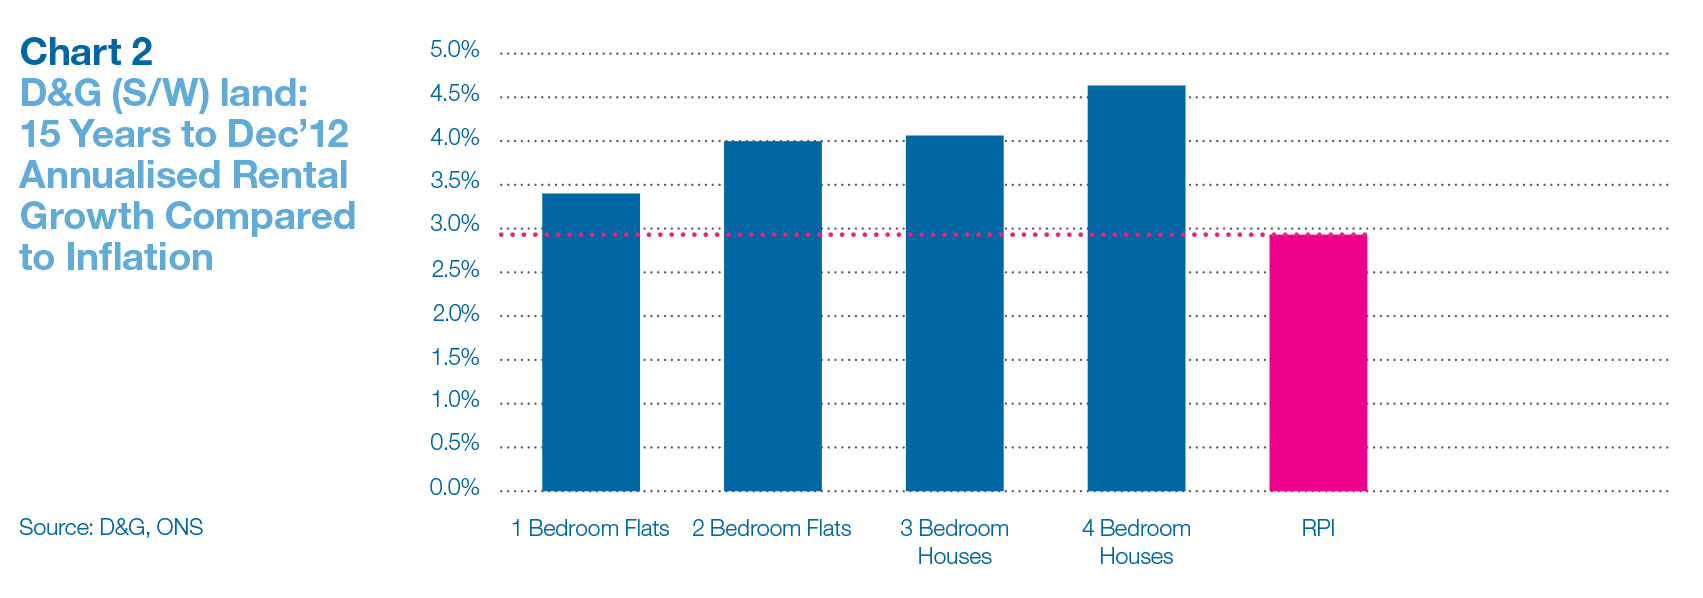
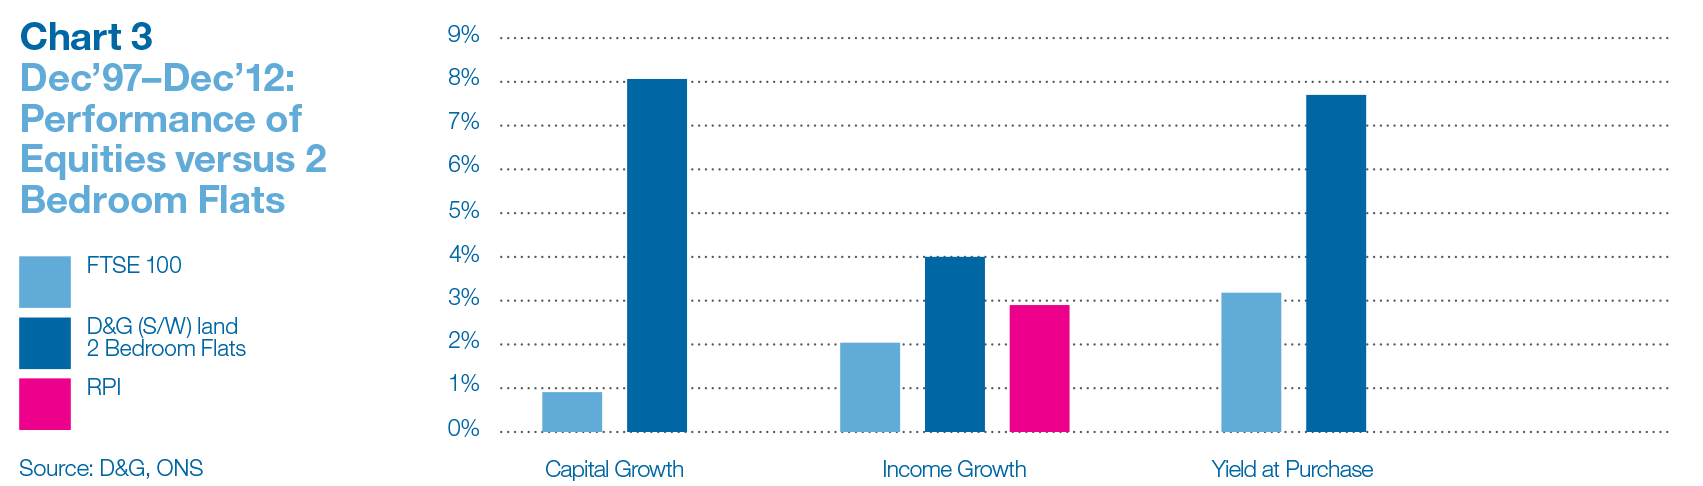
Chart 3
Chart 3 compares the annual dividend growth for equities versus annual rental growth for a standard 2 bedroom flat in D&G (S/W) land between 1997–2012.
The right-hand bars show that the initial yield was higher on the 2 bedroom flats (7.5%) than on the FTSE 100 (3.2%).
The middle bars show that rental growth (4%) was higher on the 2 bedroom flats than dividend growth (2%) on equities. RPI was close to 3%.
The left-hand bars show that the annualised capital return for the flat (8% p/a) was much higher than for equities (1%).
And finally...
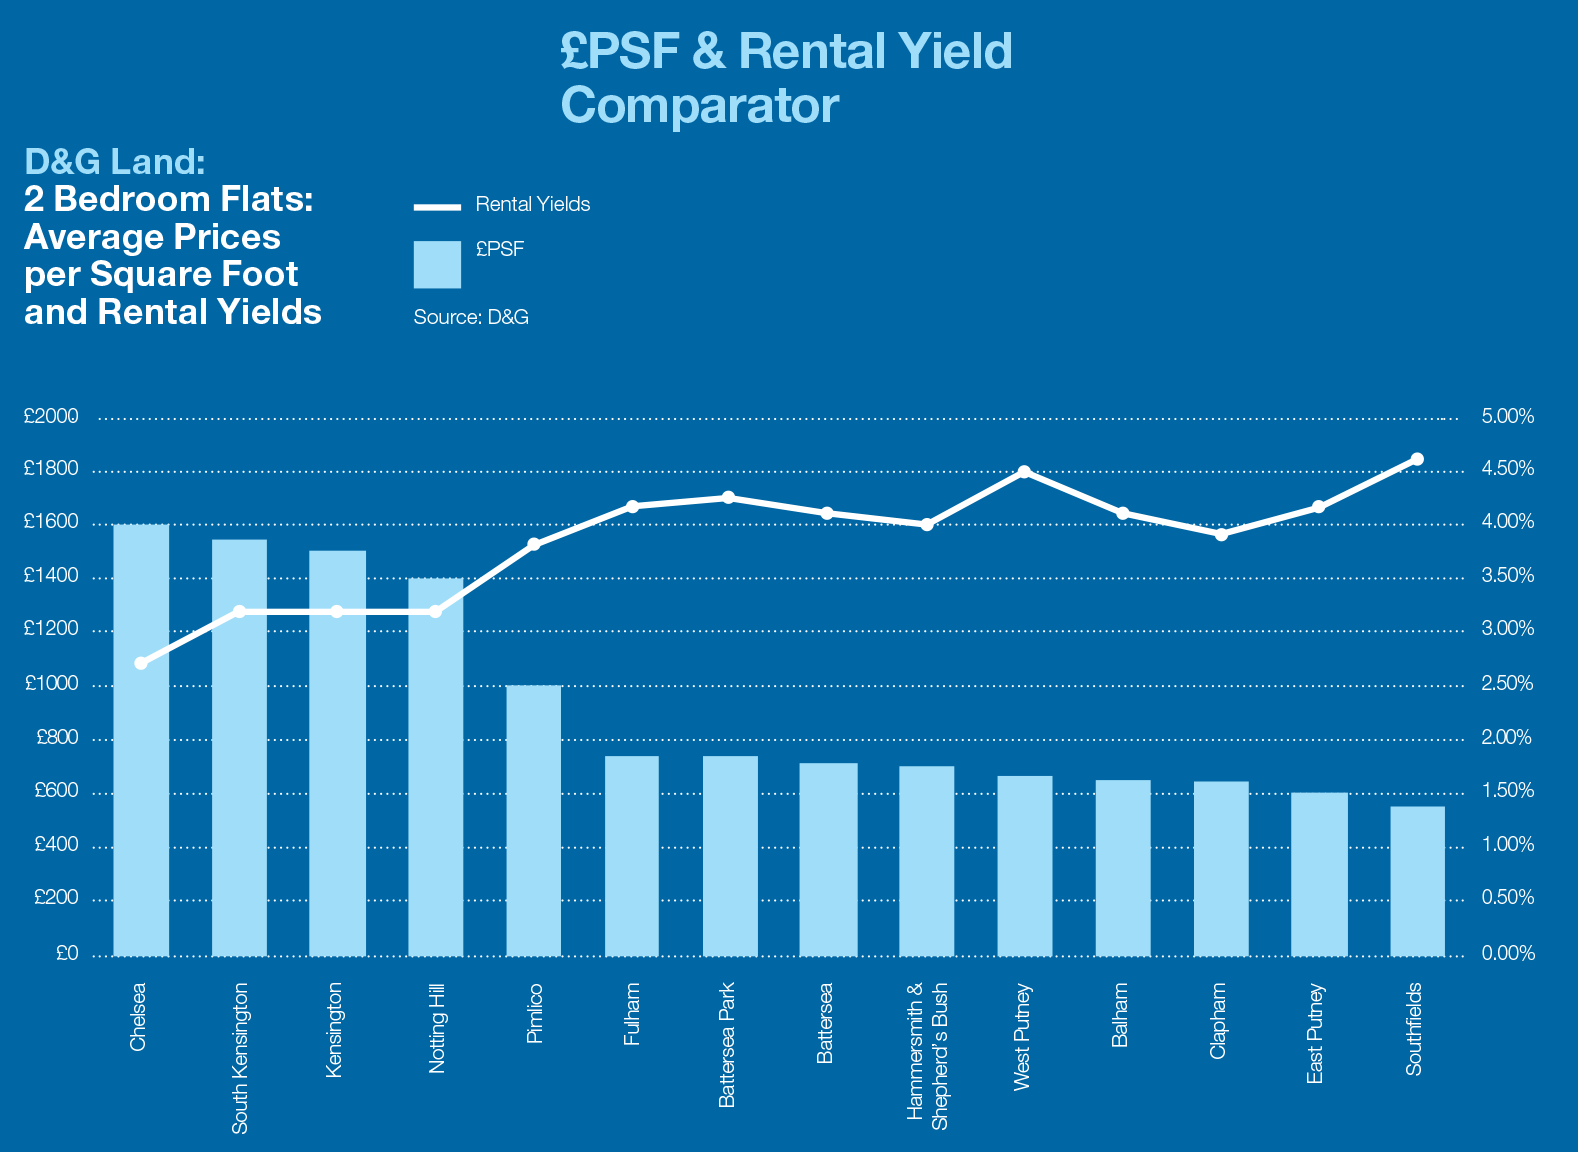
D&G Research covers all 14 of the London areas where Douglas & Gordon has an office, a full sales and lettings team and long-standing, proprietary and reliable data. The chart (above) gives an idea of the relative position of the different areas from the perspective of average PSF and rental yields. If you would like to read research on other D&G areas, or talk to either our research team or a negotiator in one of the offices, please contact Andrew Monteath, Head of Research D&GAM on [email protected]
Key Contacts
Charlie Mitchell
Sales Manager
+44 (0)20 8788 3000
[email protected]
Georgie Petras
Lettings Associate
+44 (0)20 8788 3333
[email protected]