Market Report 1st Quarter 2013 Pimlico and Westminster

Pimlico & Westminster
Chart 1
Pimlico & Westminster has not been as affected by the lack of mortgage credit as other areas.
Capital values for two bedroom flats have, during the last 5 years of tight credit, outperformed other areas in D&G (S/W) land*.
The area is starting to show the same characteristics as Prime Central London, for example:
- – high percentage of cash (and /or)overseas buyers
- – investors looking for total return/capital preservation not simply yield
- – residential new-build supply likely to set record £PSF benchmarks.
The area is undergoing a re-rating due to improvement in offices and other commercial premises on Victoria Street.
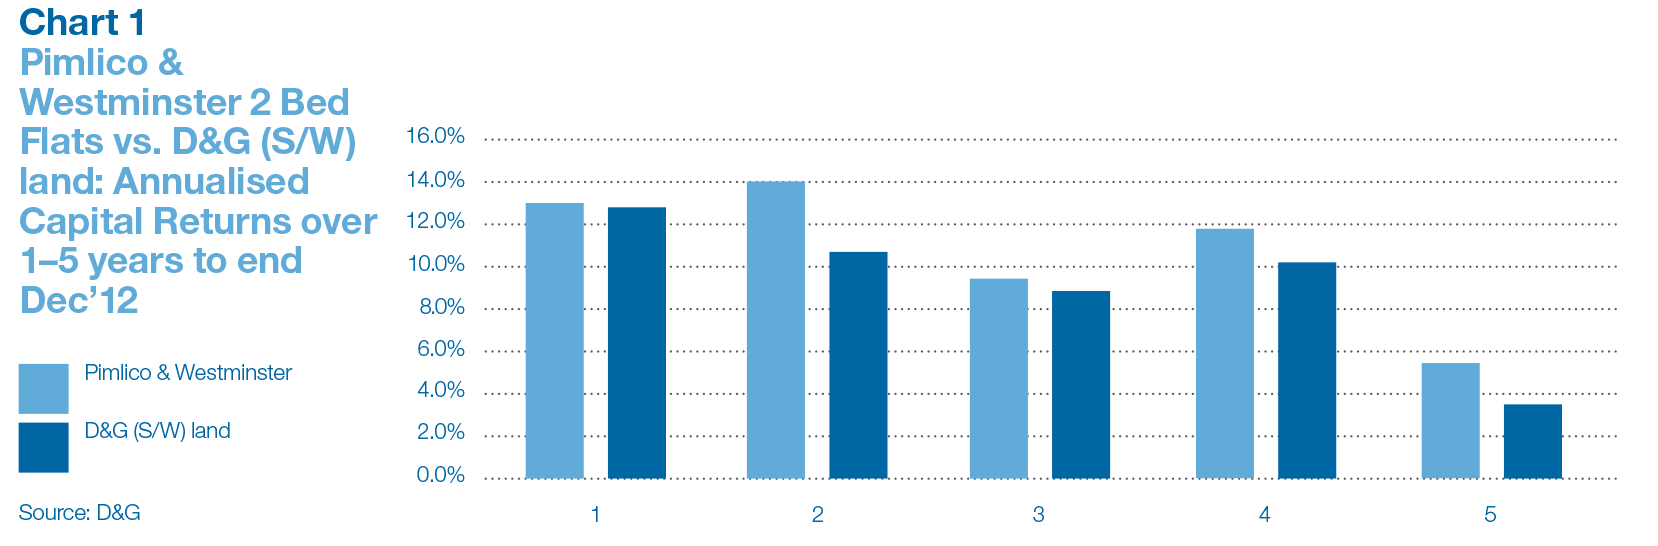
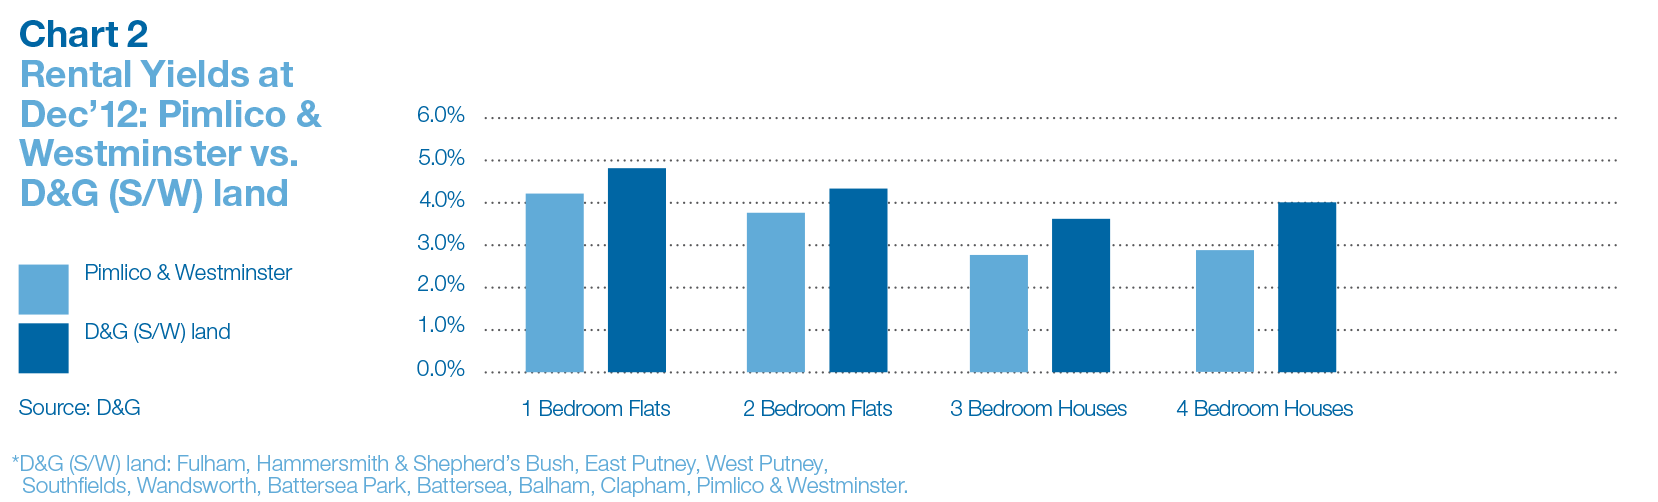
Chart 2
Pimlico & Westminster yields on all unit sizes are lower than in the rest of D&G (S/W) land and rents have been weak in the first part of 2013.
Outlook
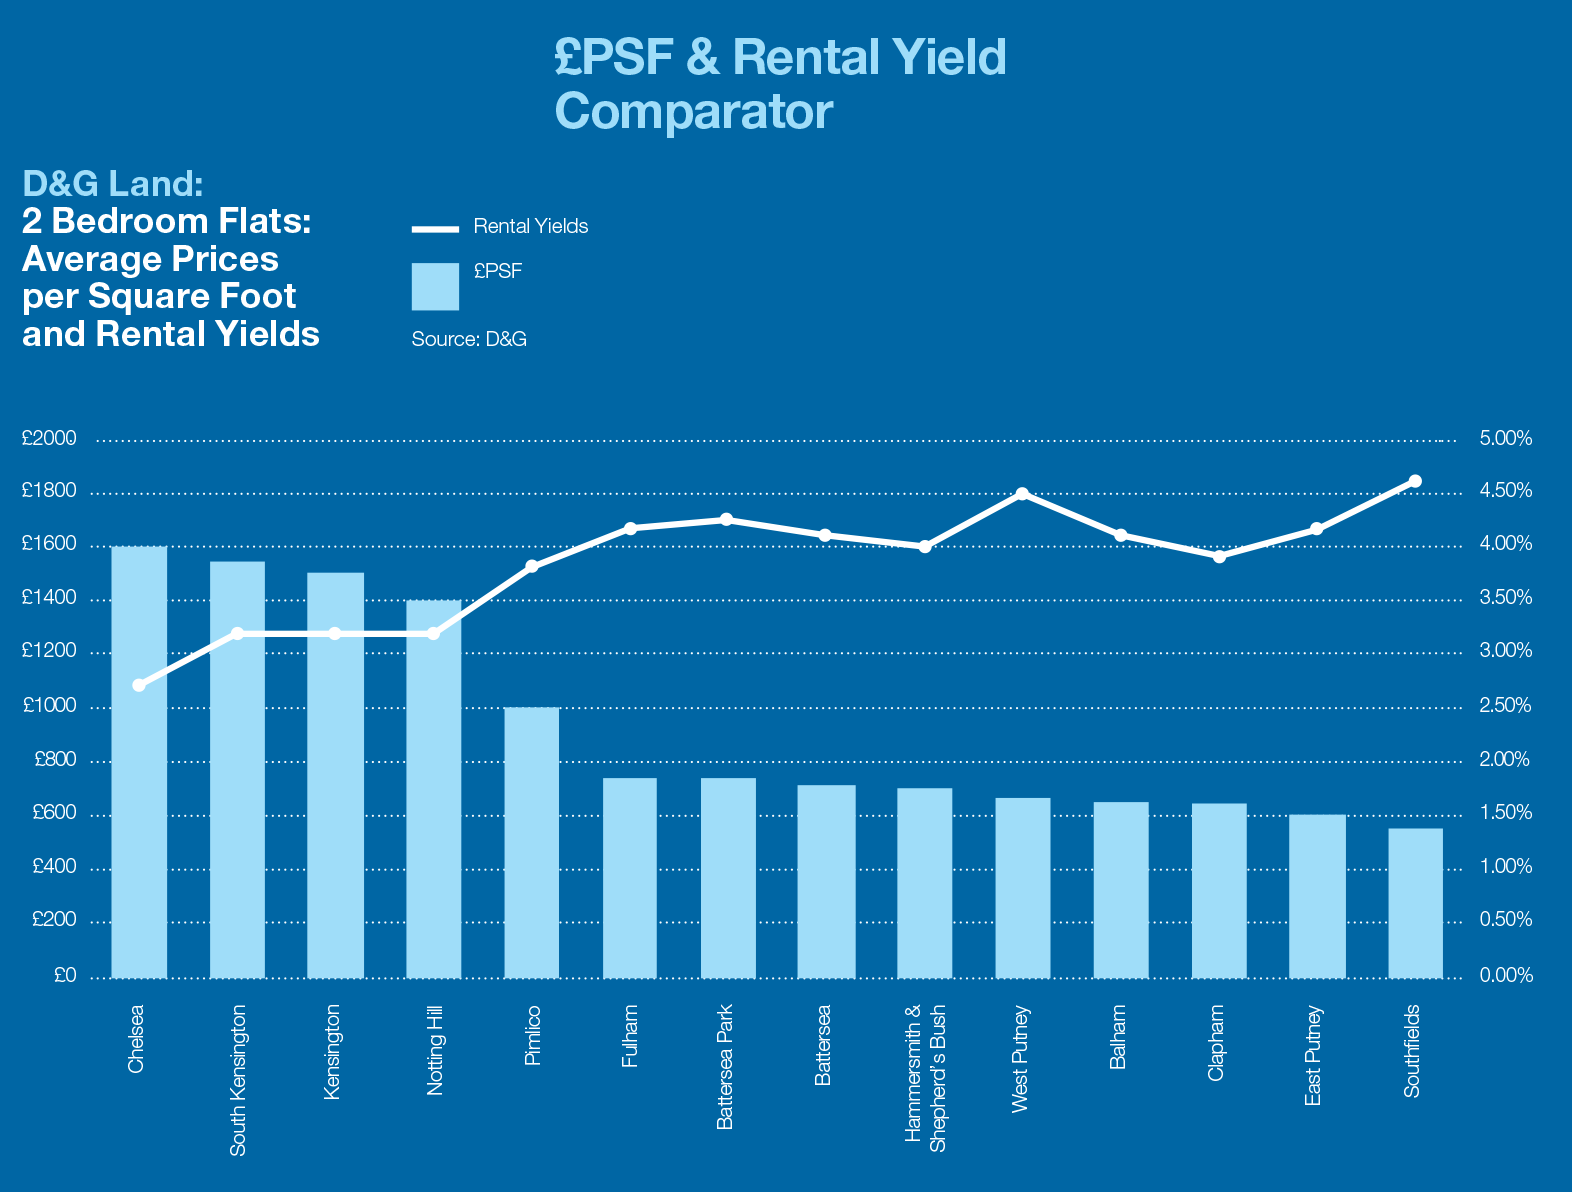
Property in the area has reached an important watershed at £1,000 PSF – see last chart.
You will also see from the last chart that Pimlico & Westminster is in statistical terms positioned between “Prime” and “D&G (S/W) land.”
Some owners might take the view that Pimlico & Westminster has had a good move over the last few years and might, over coming months/years, lag behind the rest of D&G (S/W) land.
Others will bet that Pimlico & Westminster will continue to develop as a “Prime” location.
Although we remain confident that in parts of Pimlico & Westminster (particularly with the classic Cubitt architectural stock on offer) the prime story will remain intact, some current prices present exit routes for those investors who
Inflation
How inflation eats away at real incomes
Chart 1
Over the 3 years to December 2012 the annualised inflation rate (RPI) has been 4.22%(2.9% over the last 15 years). Source: ONS
At an annualised rate of 4% over 15 yearsinflation will erode your real income by 44%.
To protect real income an asset must generate income growth that matches inflation.
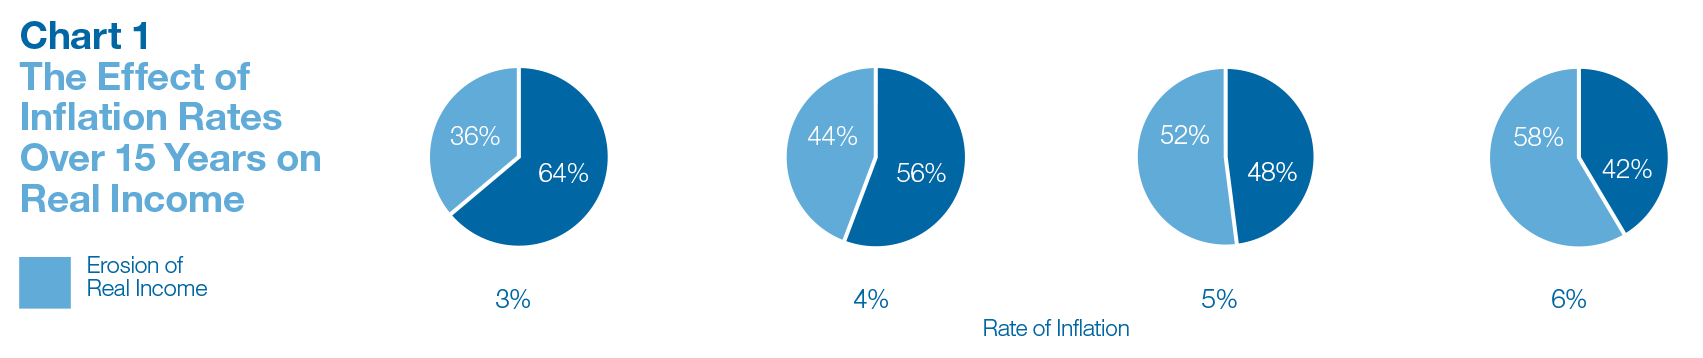
Chart 2
Different property unit sizes across D&G (S/W) land have shown different rates of rental growth but all have matched or exceeded inflation.
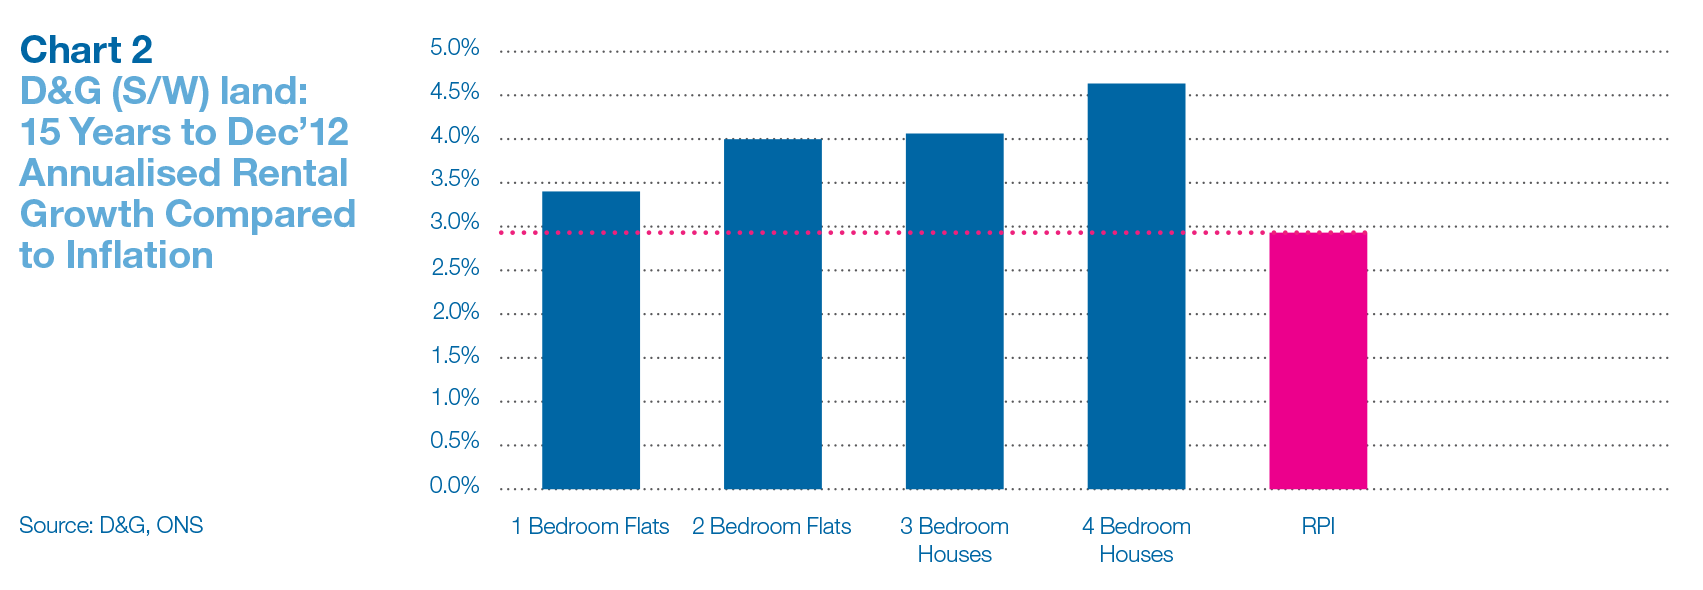
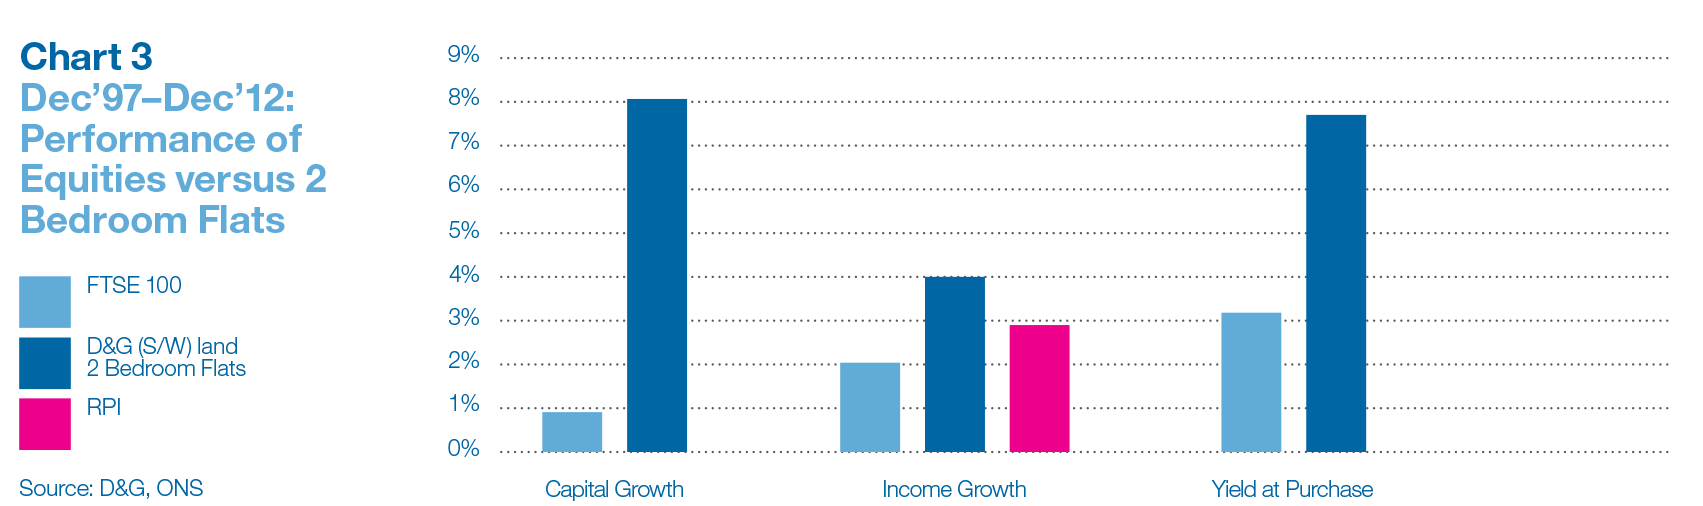
Chart 3
Chart 3 compares the annual dividend growth for equities versus annual rental growth for a standard 2 bedroom flat in D&G (S/W) land between 1997–2012.
The right-hand bars show that the initial yield was higher on the 2 bedroom flats (7.5%) than on the FTSE 100 (3.2%).
The middle bars show that rental growth (4%) was higher on the 2 bedroom flats than dividend growth (2%) on equities. RPI was close to 3%.
The left-hand bars show that the annualised capital return for the flat (8% p/a) was much higher than for equities (1%).
And finaly...
D&G Research covers all 14 of the London areas where Douglas & Gordon has an office, a full sales and lettings team and long-standing, proprietary and reliable data. The chart (above) gives an idea of the relative position of the different areas from the perspective of average PSF and rental yields. If you would like to read research on other D&G areas, or talk to either our research team or a negotiator in one of the offices, please contact Andrew Monteath, Head of Research D&GAM on [email protected]
Key Contacts
Alexander Leschallas
Sales Associate
+44 (0)20 7931 8200
[email protected]
Louise Verrall
Lettings Manager
+44 (0)20 7931 8300
[email protected]