Market Report 1st Quarter 2013 Fulham Hammersmith and Shepherds Bush

“We analyse the absolute performance of residential property in each of the 14 London areas covered by Douglas & Gordon. We also examine the relative performance, comparing different unit sizes and different areas. Finally, in a city that attracts global investors, we try to place residential property performance in a wider macro-economic context.”
Fulham, Hammersmith & Shepherd’s Bush
How have the areas performed 2008–2012?
Chart 1 & 2
Unlike most areas of D&G (S/W) land* during 2008–2012, lack of credit/mortgage finance has not impacted on capital values.
Capital values have risen across all unit sizes, as housing equity/capital has been re-deployed from other areas.
Family houses have risen much faster than flats (in Hammersmith it is the school catchment areas that have particularly outperformed).
In both areas 2 bedroom flats have risen faster in value than 1 bedroom flats (1 bedroom flats in Fulham have underperformed versus Hammersmith).


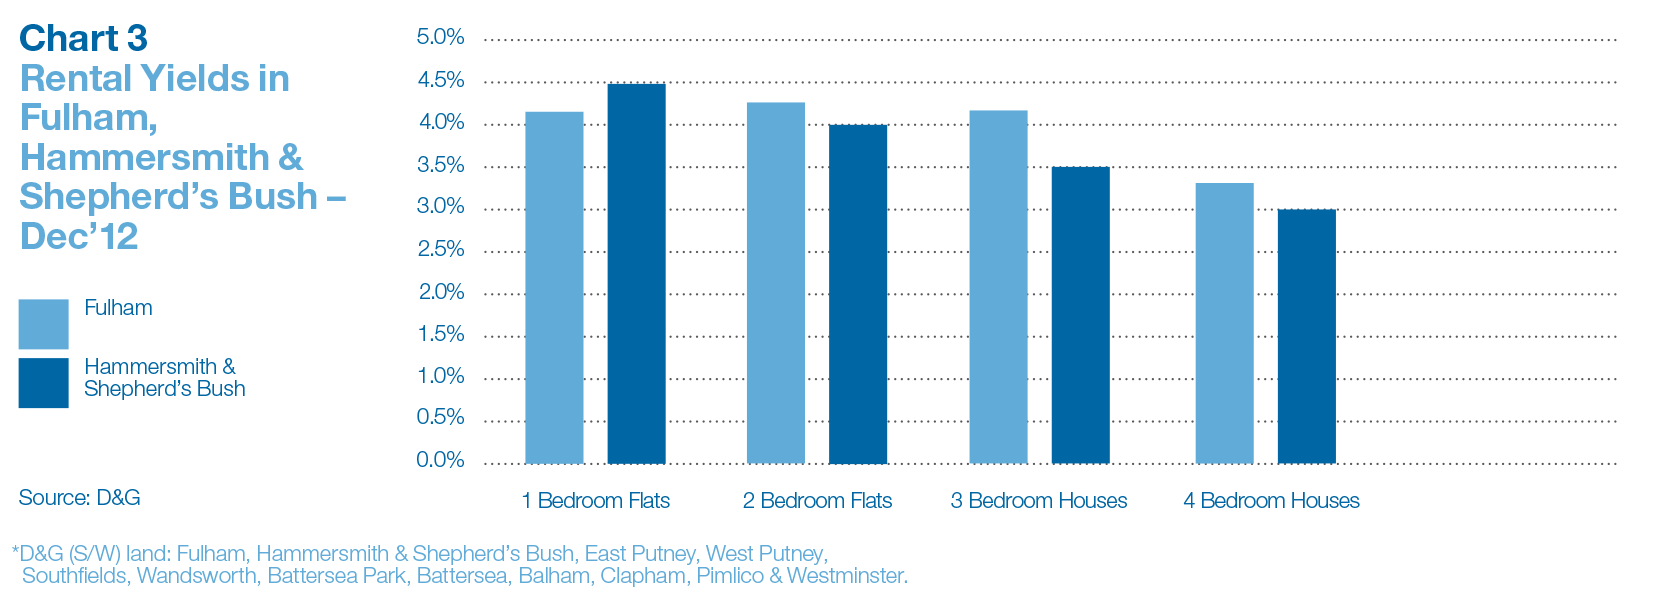
Chart 3
Yields on houses in both areas are currently at levels seen in Prime Central London (Chelsea, Kensington, Knightsbridge).
Given that both areas have seen very strong capital growth, current rental yields are still respectable at above 4% for flats.
Rents in Fulham, which were the first to soften in D&G (S/W) land during 2012, are showing signs of firming in 2013.
Inflation
How inflation eats away at real incomes
Chart 1
Over the 3 years to December 2012 the annualised inflation rate (RPI) has been 4.22%(2.9% over the last 15 years). Source: ONS
At an annualised rate of 4% over 15 years inflation will erode your real income by 44%.
To protect real income an asset must generate income growth that matches inflation.
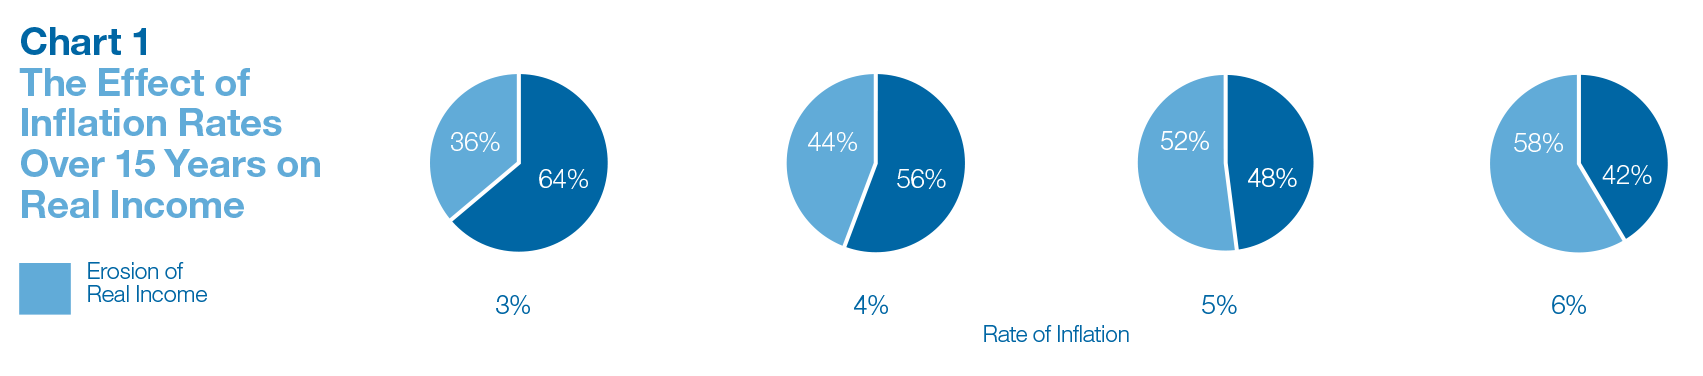
Chart 2
Different property unit sizes across D&G (S/W) land have shown different rates of rental growth but all have matched or exceeded inflation.
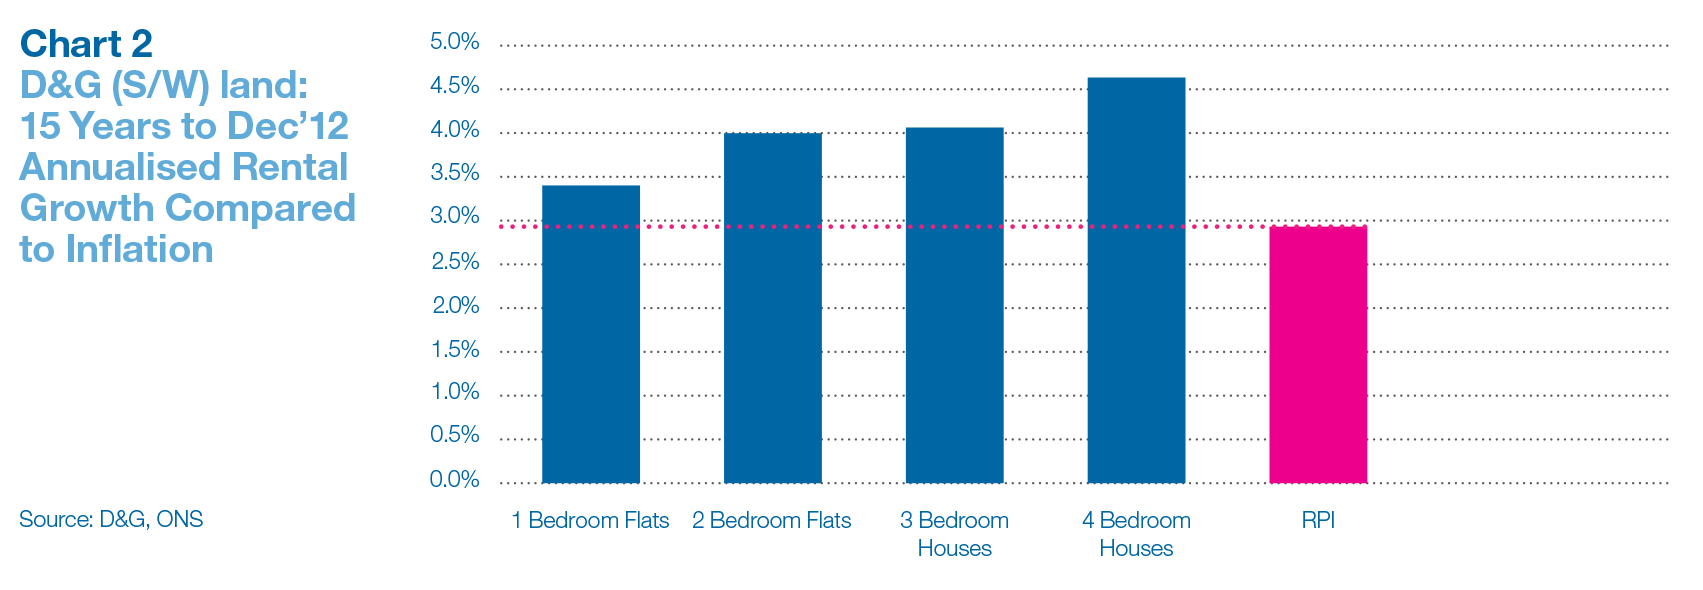
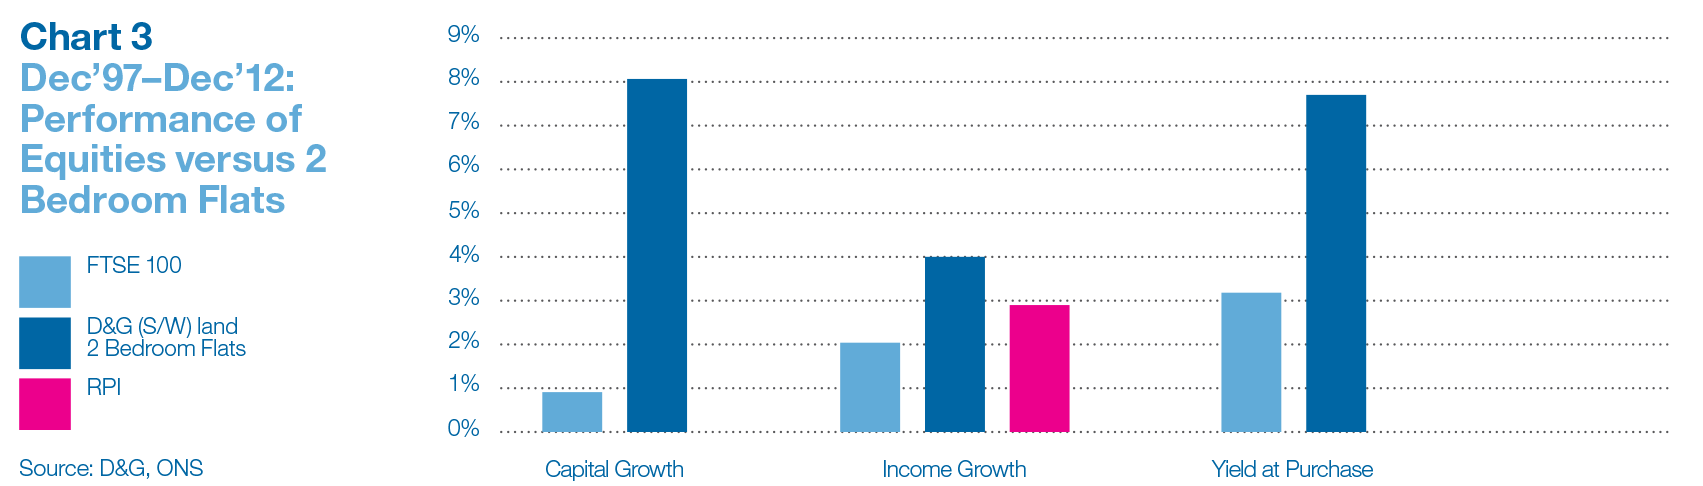
Chart 3
Chart 3 compares the annual dividend growth for equities versus annual rental growth for a standard 2 bedroom flat in D&G (S/W) land between 1997–2012.
The right-hand bars show that the initial yield was higher on the 2 bedroom flats (7.5%) than on the FTSE 100 (3.2%).
The middle bars show that rental growth (4%) was higher on the 2 bedroom flats than dividend growth (2%) on equities. RPI was close to 3%.
The left-hand bars show that the annualised capital return for the flat (8% p/a) was much higher than for equities (1%).
And finally...
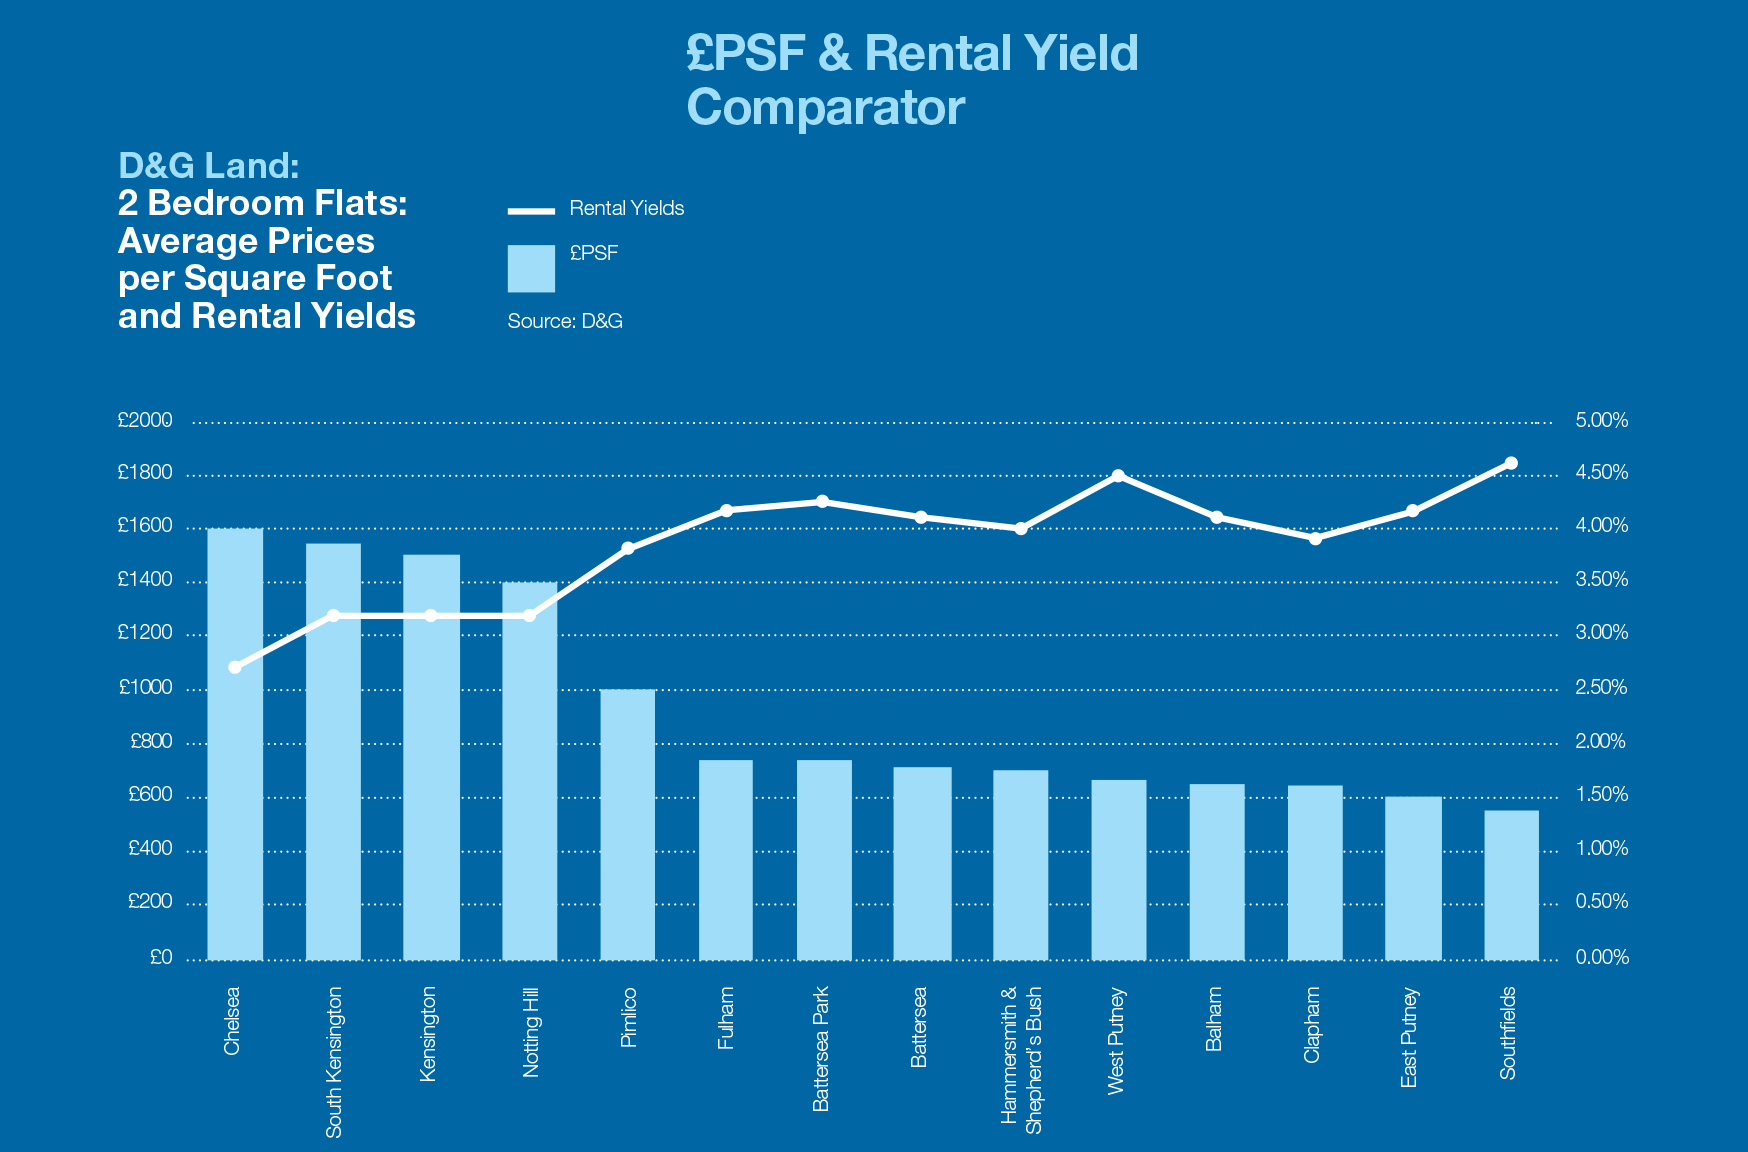
D&G Research covers all 14 of the London areas where Douglas & Gordon has an office, a full sales and lettings team and long-standing, proprietary and reliable data. The chart (above) gives an idea of the relative position of the different areas from the perspective of average PSF and rental yields. If you would like to read research on other D&G areas, or talk to either our research team or a negotiator in one of the offices, please contact Andrew Monteath, Head of Research D&GAM on info@dngam.com
Key Contacts
Emma Hanks
Sales Associate Director
+44 (0)20 7731 4391
ehanks@dng.co.uk
Ella Newhouse
Lettings Associate Director
+44 (0)20 7731 4791
enewhouse@dng.co.uk