Market Report 1st Quarter 2013 Balham Battersea Battersea Park Clapham

“We analyse the absolute performance of residential property in each of the 14 London areas covered by Douglas & Gordon. We also examine the relative performance, comparing different unit sizes and different areas. Finally, in a city that attracts global investors, we try to place residential property performance in a wider macro-economic context.”
Battersea Park, Battersea, Clapham & Balham
What has happened between 2007-2012?
Chart 1
In most areas smaller unit sizes (1 bedroom flats), which are more dependent on availability of credit/mortgage finance, have underperformed the capital performance of houses.
The exception is Balham where yields on 1 bedroom flats were 6% in 2008 thus attracting buy-to-let investors along the Northern Line spine (small flats in Balham have outperformed thosein Battersea).
The house market has benefited as capital/equity has been redeployed from other areas.
In the last three years, as infrastructure projects have been given the go ahead, all unit sizes in Battersea Park have outperformed other areas.
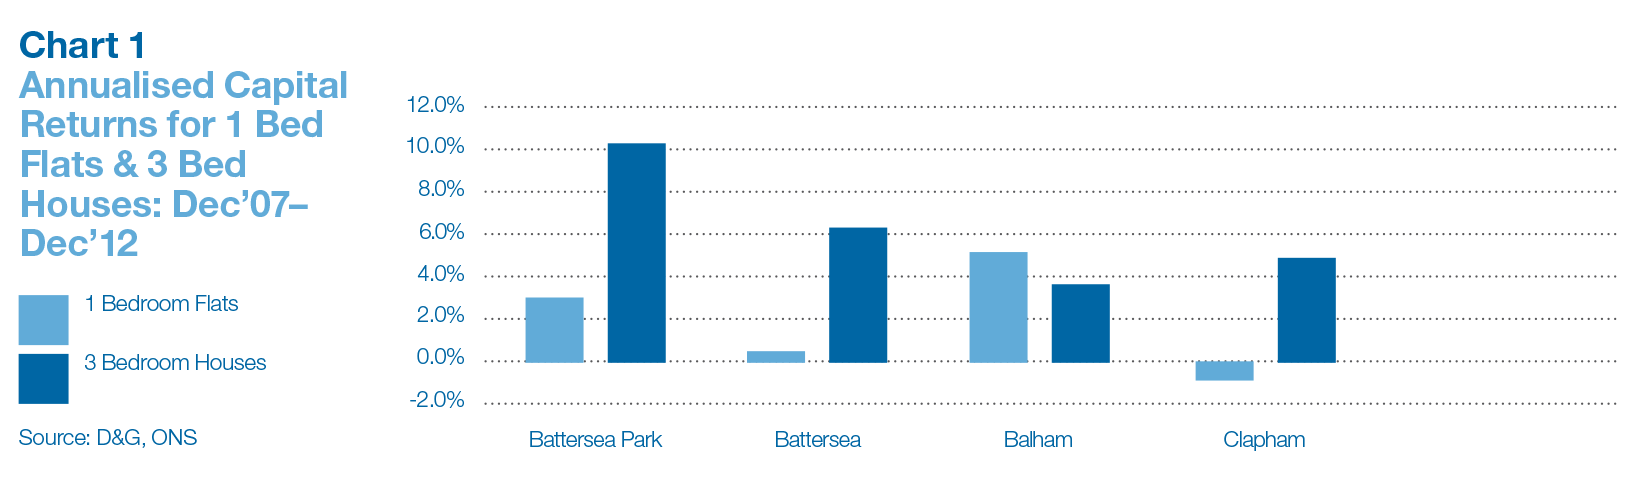
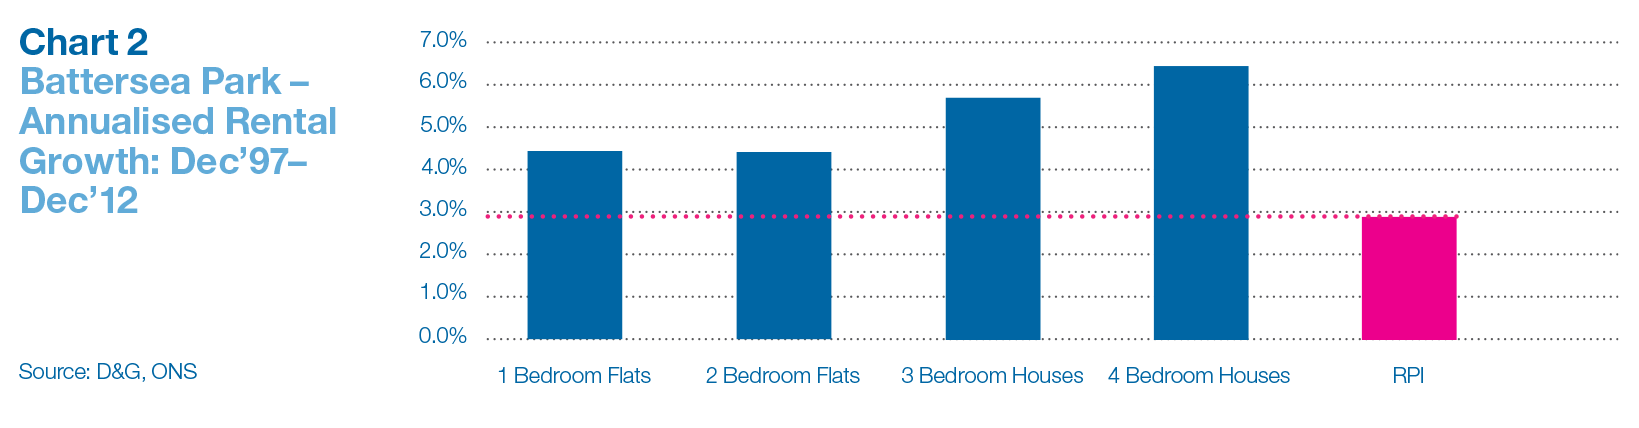
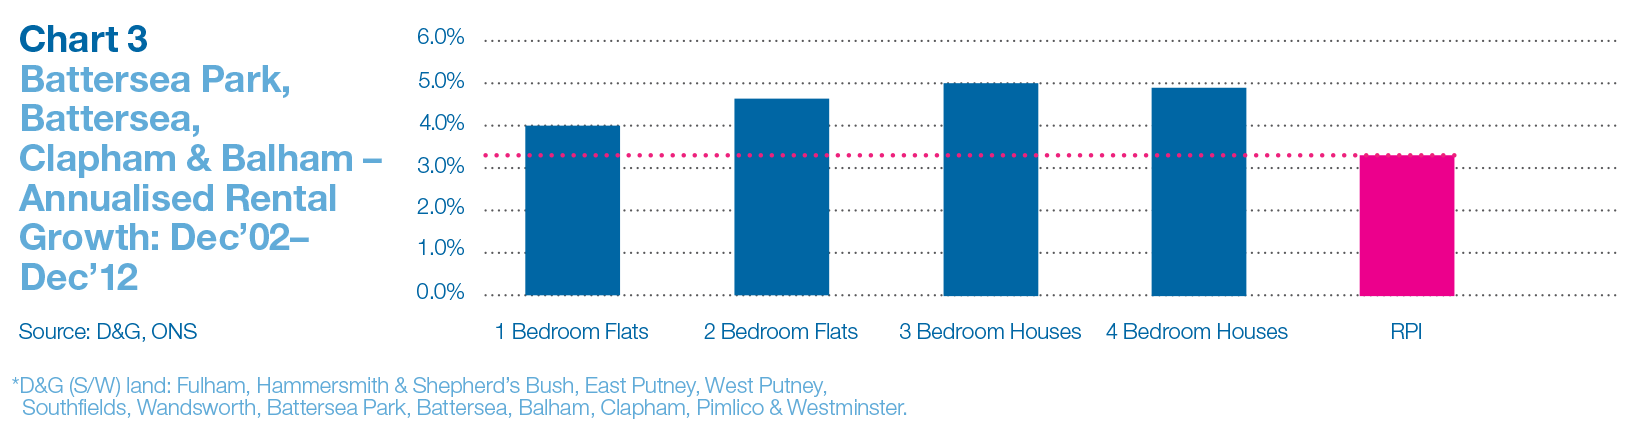
Chart 2 & 3
In Battersea Park, Battersea, Clapham and Balham all unit sizes have protected real income by delivering above-inflation rental growth.
Over the past 15 years the area has benefited from a significant growth in overseas buyers and renters moving into grids popular with domestic residents.
With current standing yields for 1 bedroom flats at 5%, and re-rating infrastructure projects imminent, we expect the area to continue to outperform much of the rest of D&G (S/W) land*.
Inflation
How inflation eats away at real incomes
Chart 1
Over the 3 years to December 2012 the annualised inflation rate (RPI) has been 4.22%(2.9% over the last 15 years). Source: ONS
At an annualised rate of 4% over 15 yearsinflation will erode your real income by 44%.
To protect real income an asset must generate income growth that matches inflation.
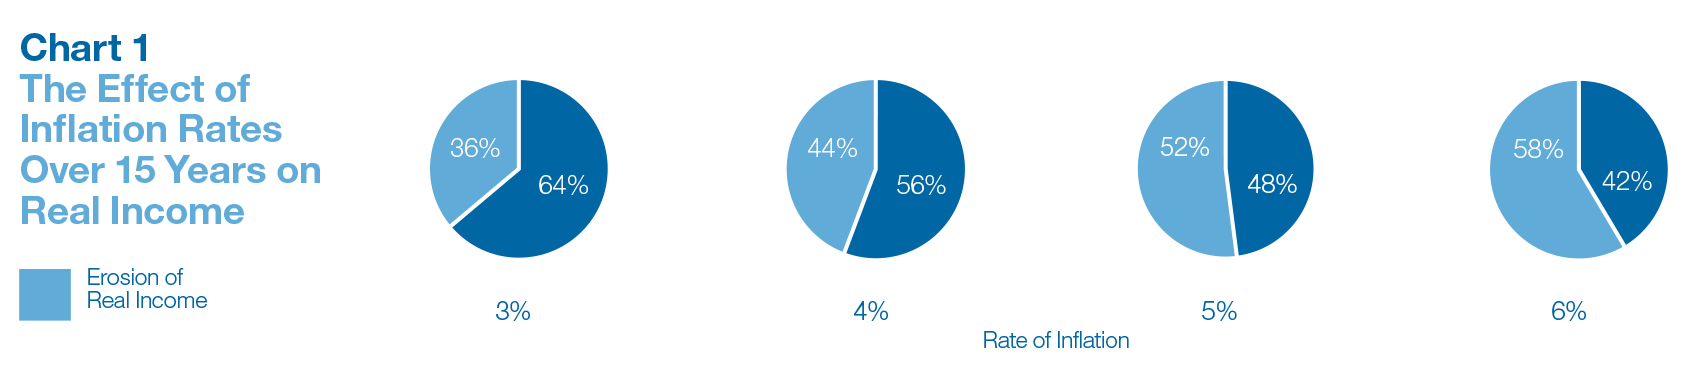
Chart 2
Different property unit sizes across D&G (S/W) land have shown different rates of rental growth but all have matched or exceeded inflation.
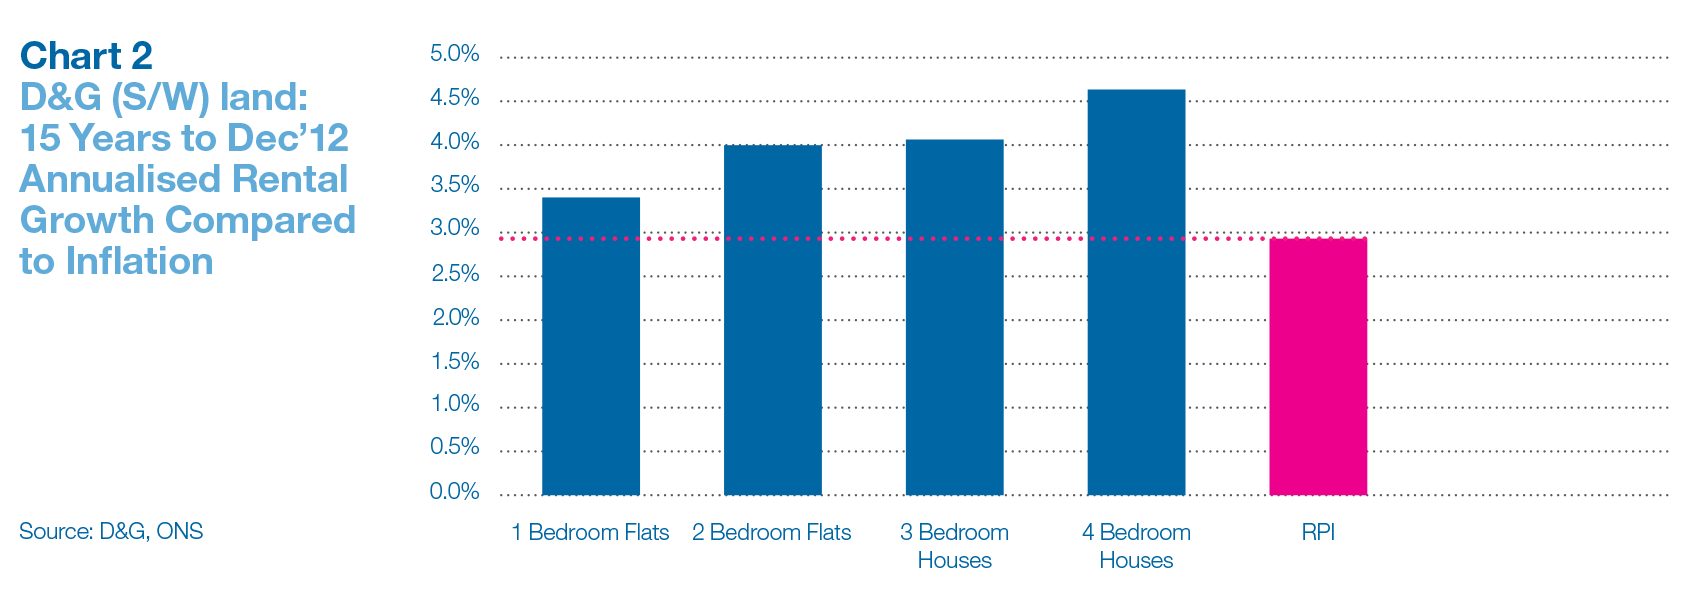
Chart 3
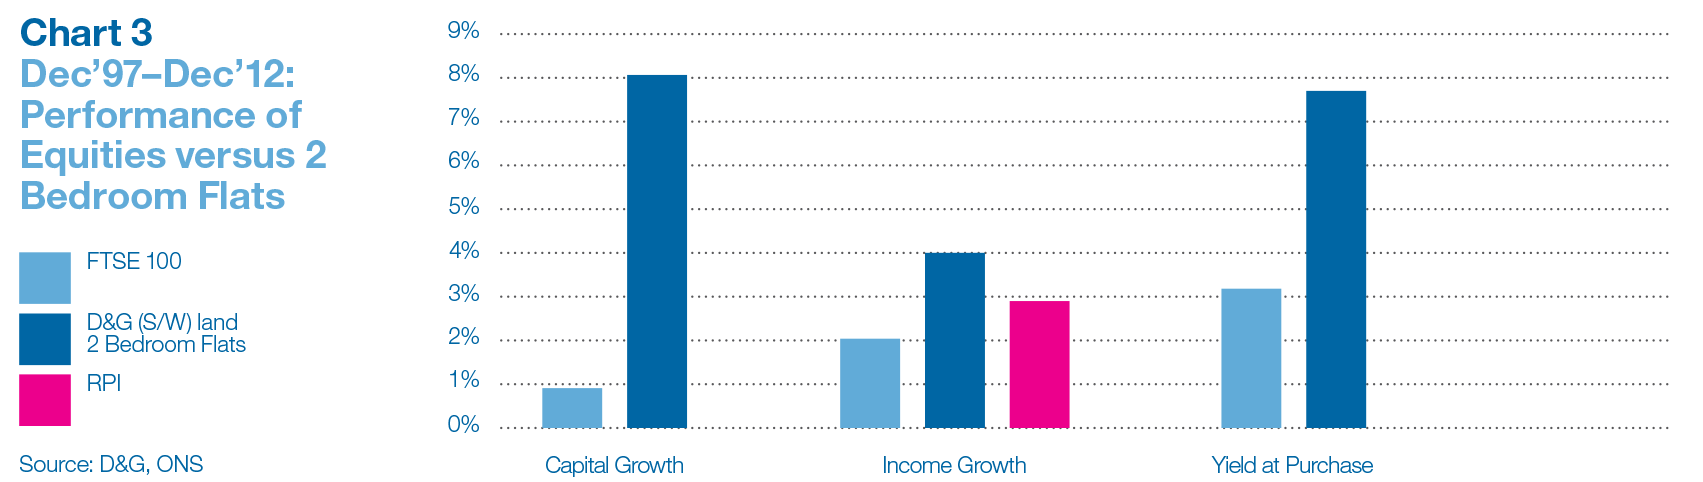
Chart 3 compares the annual dividend growth for equities versus annual rental growth for a standard 2 bedroom flat in D&G (S/W) land between 1997–2012.
The right-hand bars show that the initial yield was higher on the 2 bedroom flats (7.5%) than on the FTSE 100 (3.2%).
The middle bars show that rental growth (4%) was higher on the 2 bedroom flats than dividend growth (2%) on equities. RPI was close to 3%.
The left-hand bars show that the annualised capital return for the flat (8% p/a) was much higher than for equities (1%).
And finally…
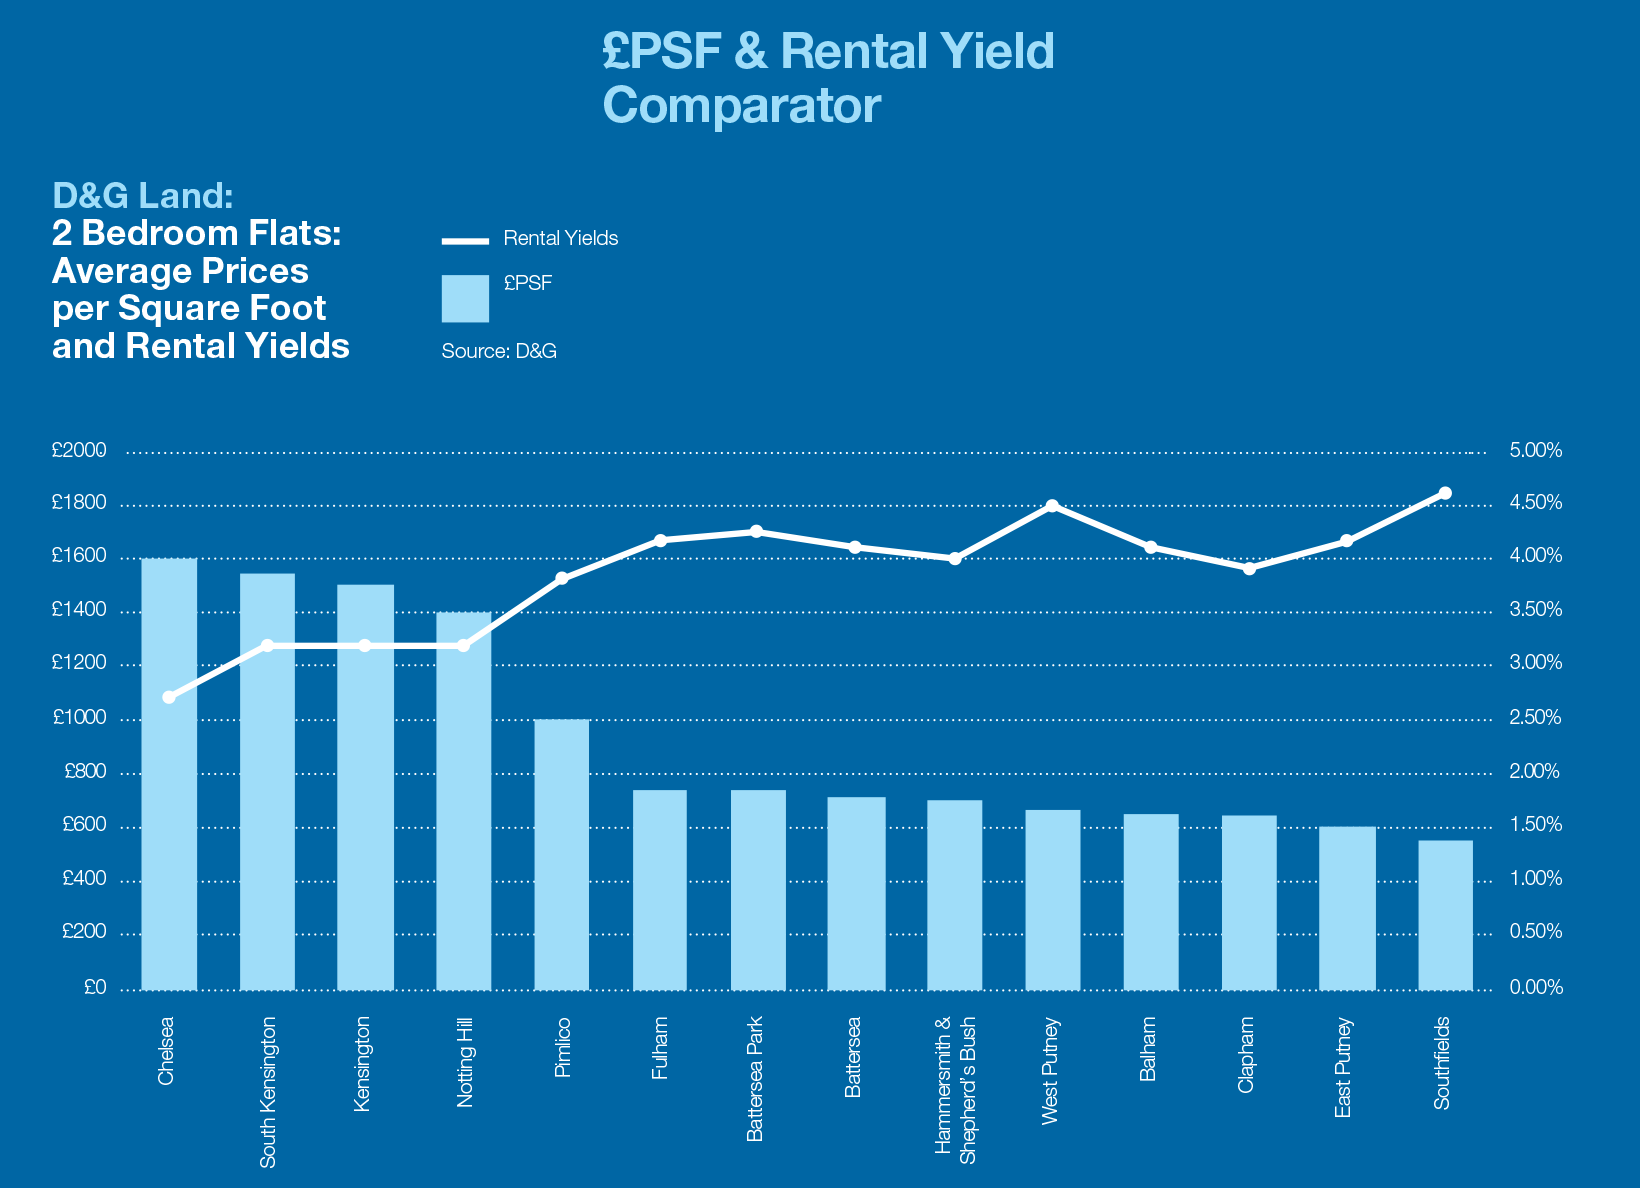
D&G Research covers all 14 of the London areas where Douglas & Gordon has an office, a full sales and lettings team and long-standing, proprietary and reliable data. The chart (above) gives an idea of the relative position of the different areas from the perspective of average PSF and rental yields. If you would like to read research on other D&G areas, or talk to either our research team or a negotiator in one of the offices, please contact Andrew Monteath, Head of Research D&GAM on info@dngam.com.
Key Contacts
Battersea Park - Mark Hutton
+44 (0)20 7720 8011
mhutton@dng.co.uk
Balham - Toby Turnage Sales Manager
+44 (0)20 8673 0191
tturnage@dng.co.uk
Annabel Hay Lettings Associate Director
+44 (0)20 7924 2002
ahay@dng.co.uk

d&g_marketreport_balham_screen.pdf